• By Applications
  • By Industries

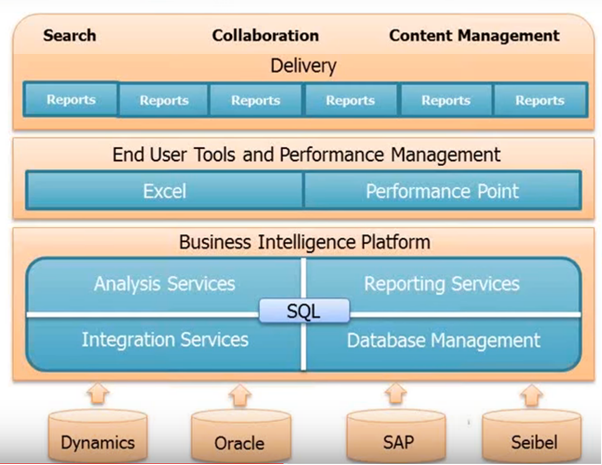
Business Intelligence System for ERP Application

Client : Fourth Generation (www.fitrix.com)
Project : Business Intelligence System For ERP Application
Industry : Retail (Electronics/Computers)
Application : Business Intelligence & Reporting Management, ERP
About Project :

Fitrix is focused on the needs of the small and medium sized manufacturer of electronics. Fitrix ERP includes a long list of features commonly needed for electronics manufacturing all in one affordable mid-range ERP solution.

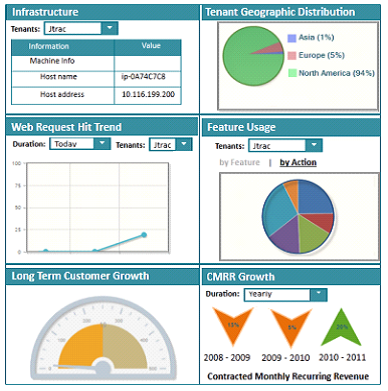
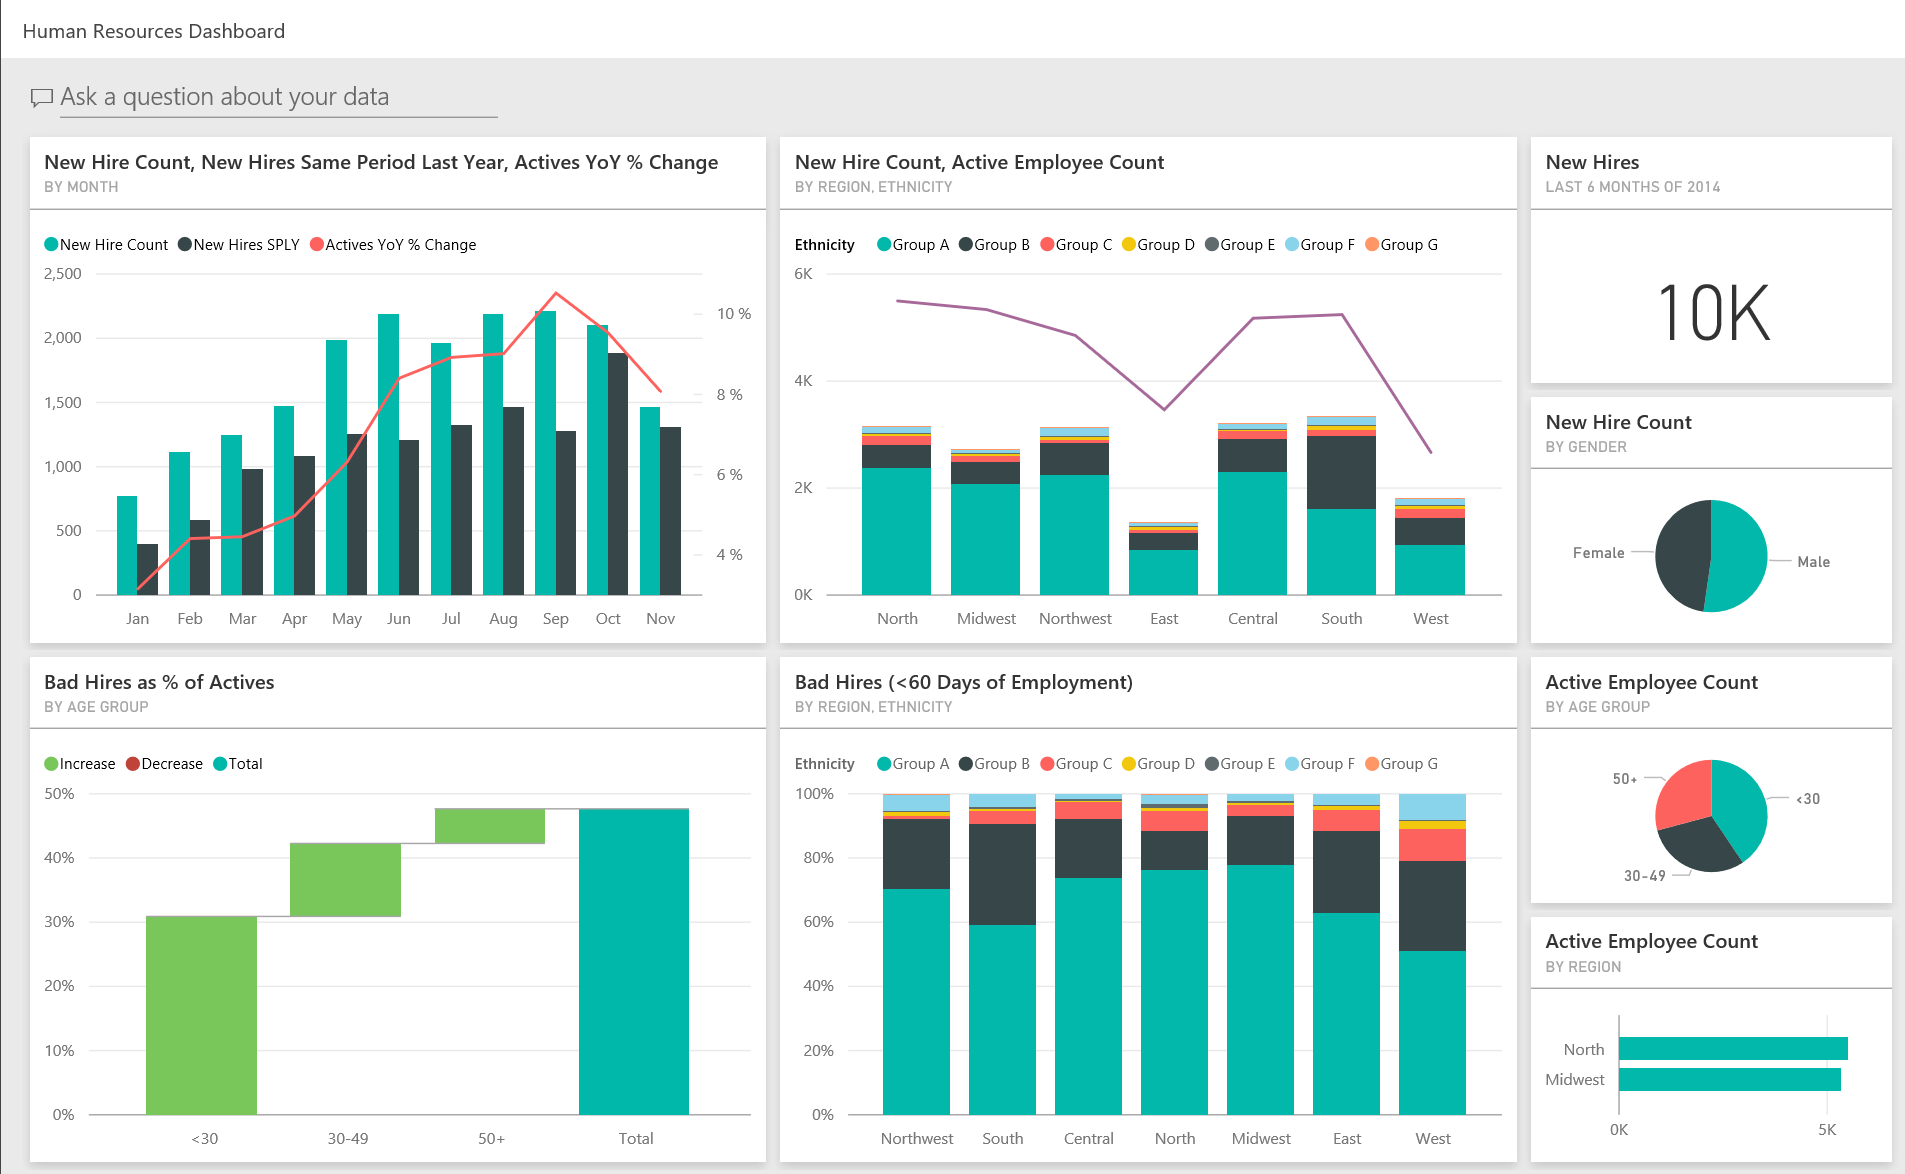
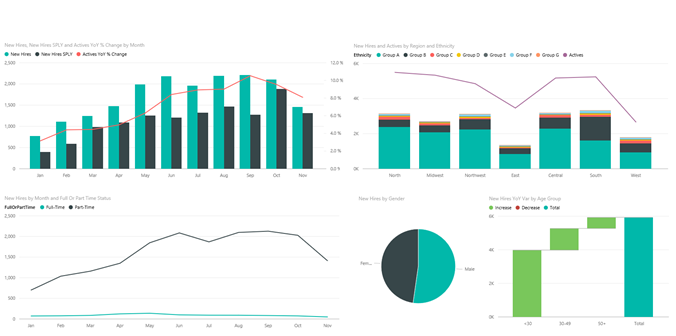
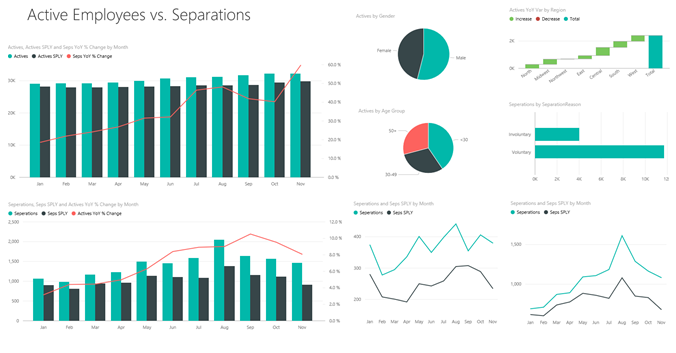
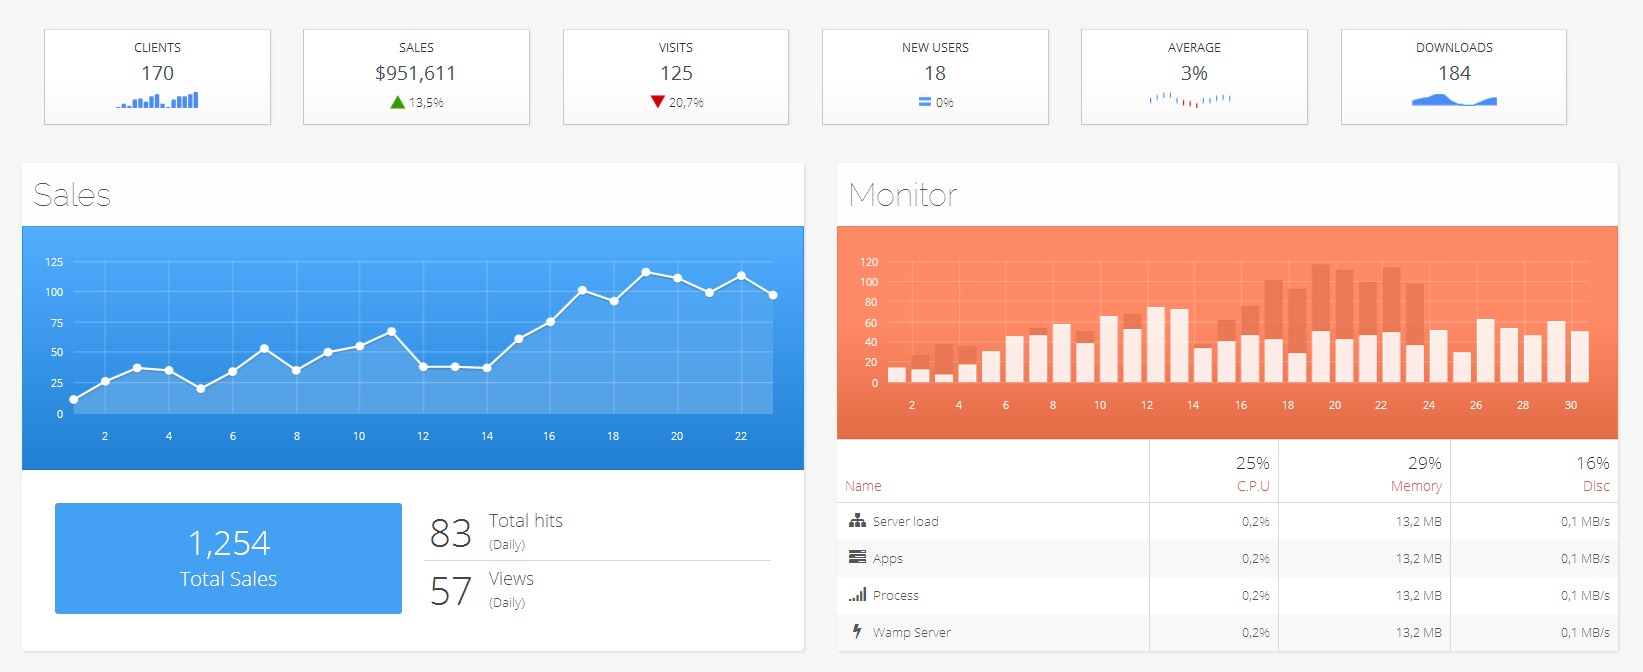
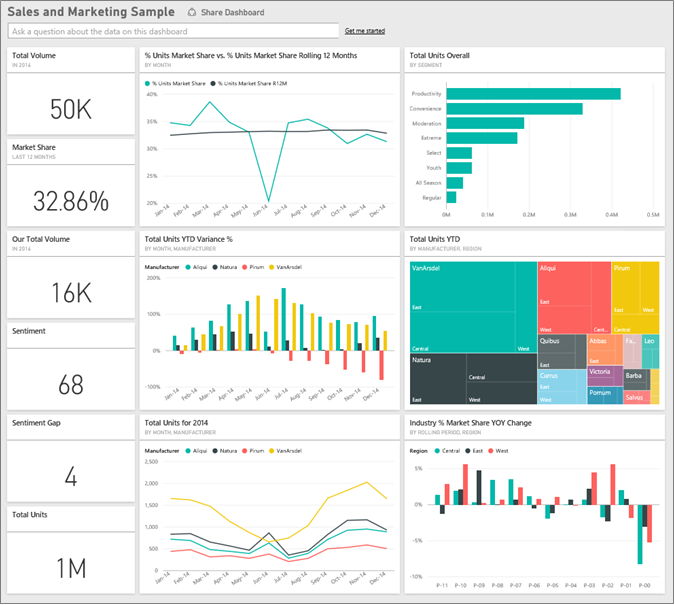
The solution was required to add Business Intelligence interface to Fitrix that can provide one shot summary with high level of accuracy in single dashboard along with various interactive reporters. The requirement was to create a Dashboard & Report Management system to display the summary of statistical data in the form of various charts.

Solution Description :

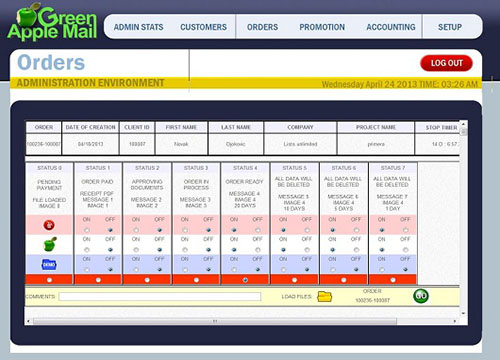
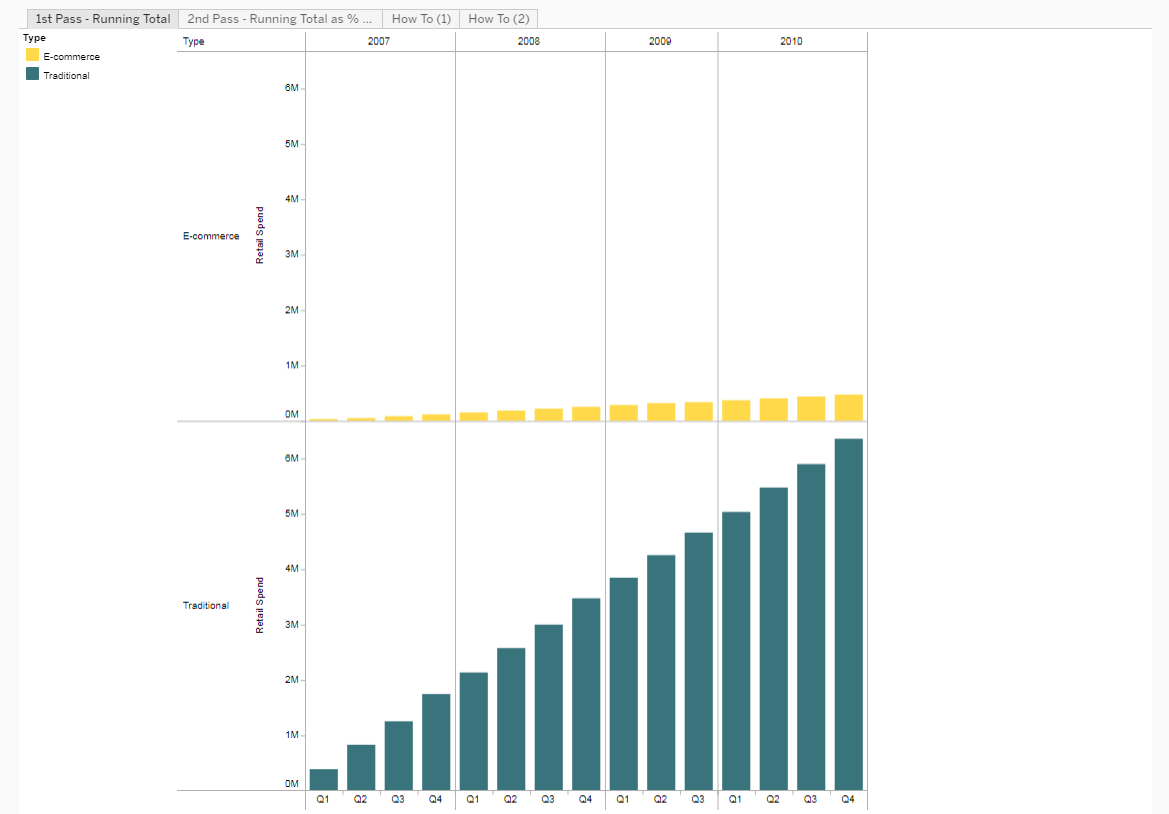
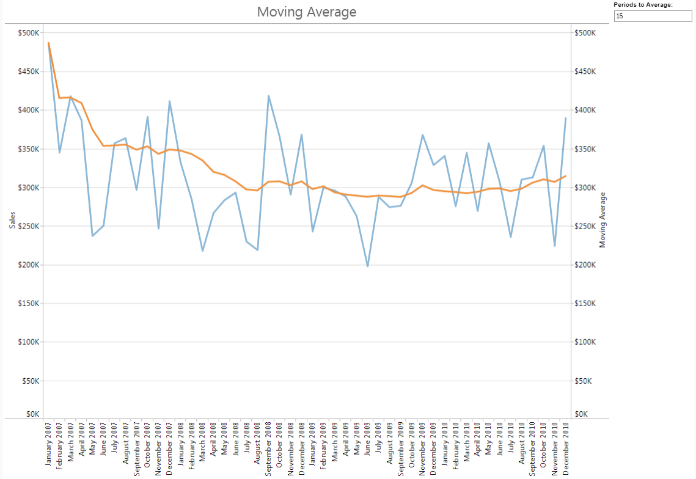
Highly interactive and responsive charts were developed to integrate in the form of dashboards. Charts like bar, pie, 3D column, area, line, scatter are developed. Each section of the charts has the drill down reports to show the detailed data. The input data to the reports are configurable and can be updated by the end user to view the desired data. The browser-based interactive viewer lets users change filtering, sorting, and column formatting changes to the report repository. Data abstraction layer for simplifying data field descriptions so non-technical users can easily understand and build their own reports.

Details on project specifications are as follows:

  • More than 40 reports and 15 dashboard views were developed in this project.
  • Reports and Dashboards were directly embedded in the application giving the feel that it is an inherent part of Fitrix
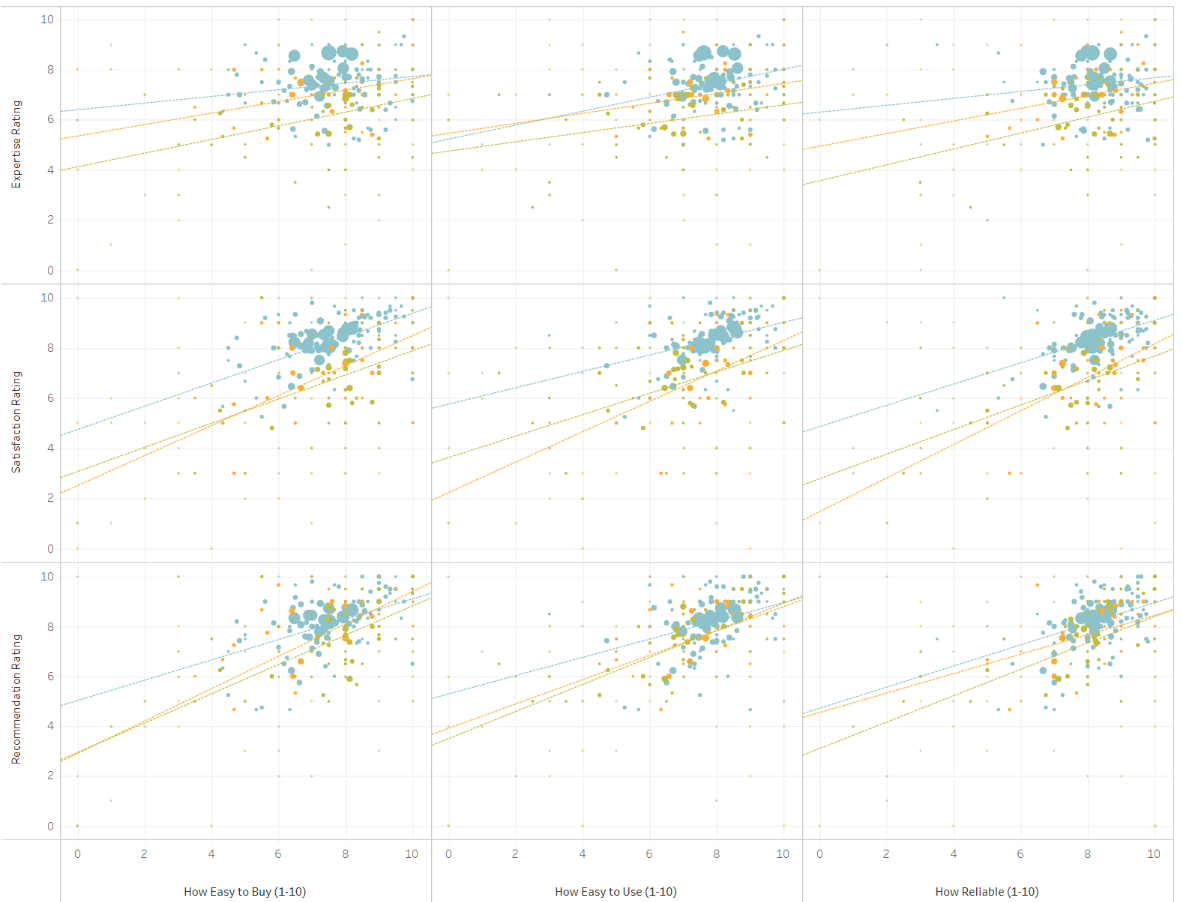
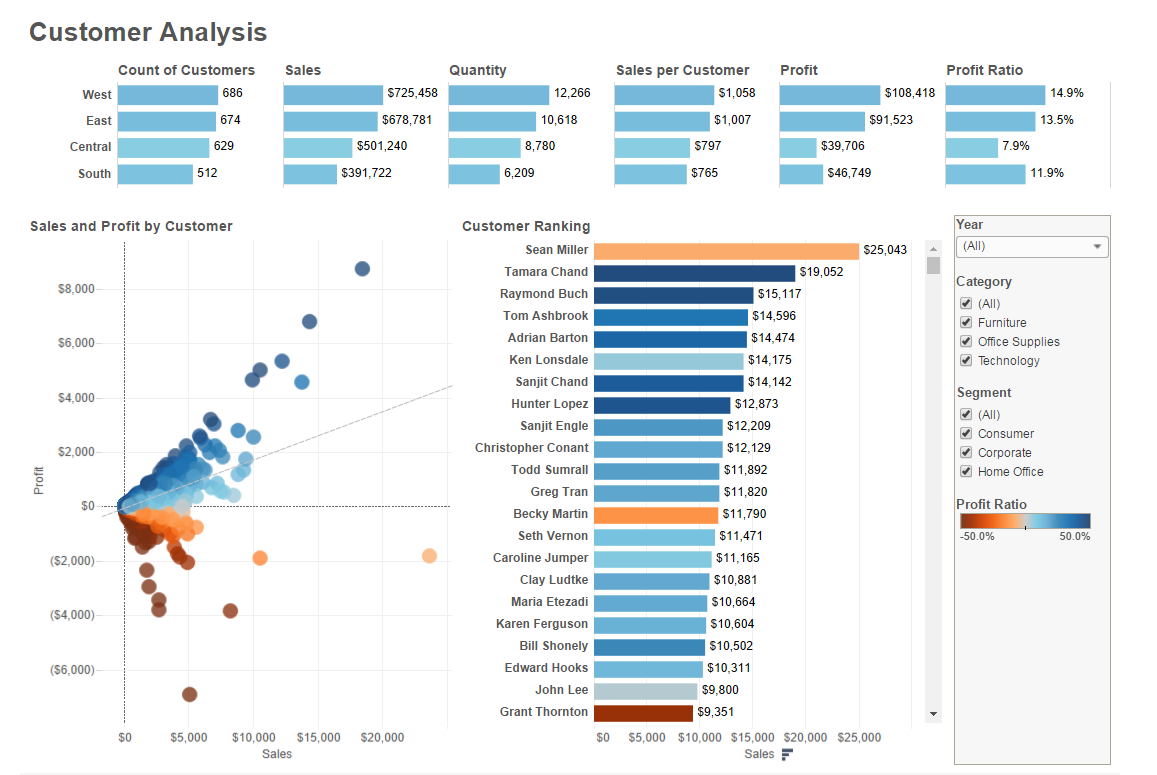
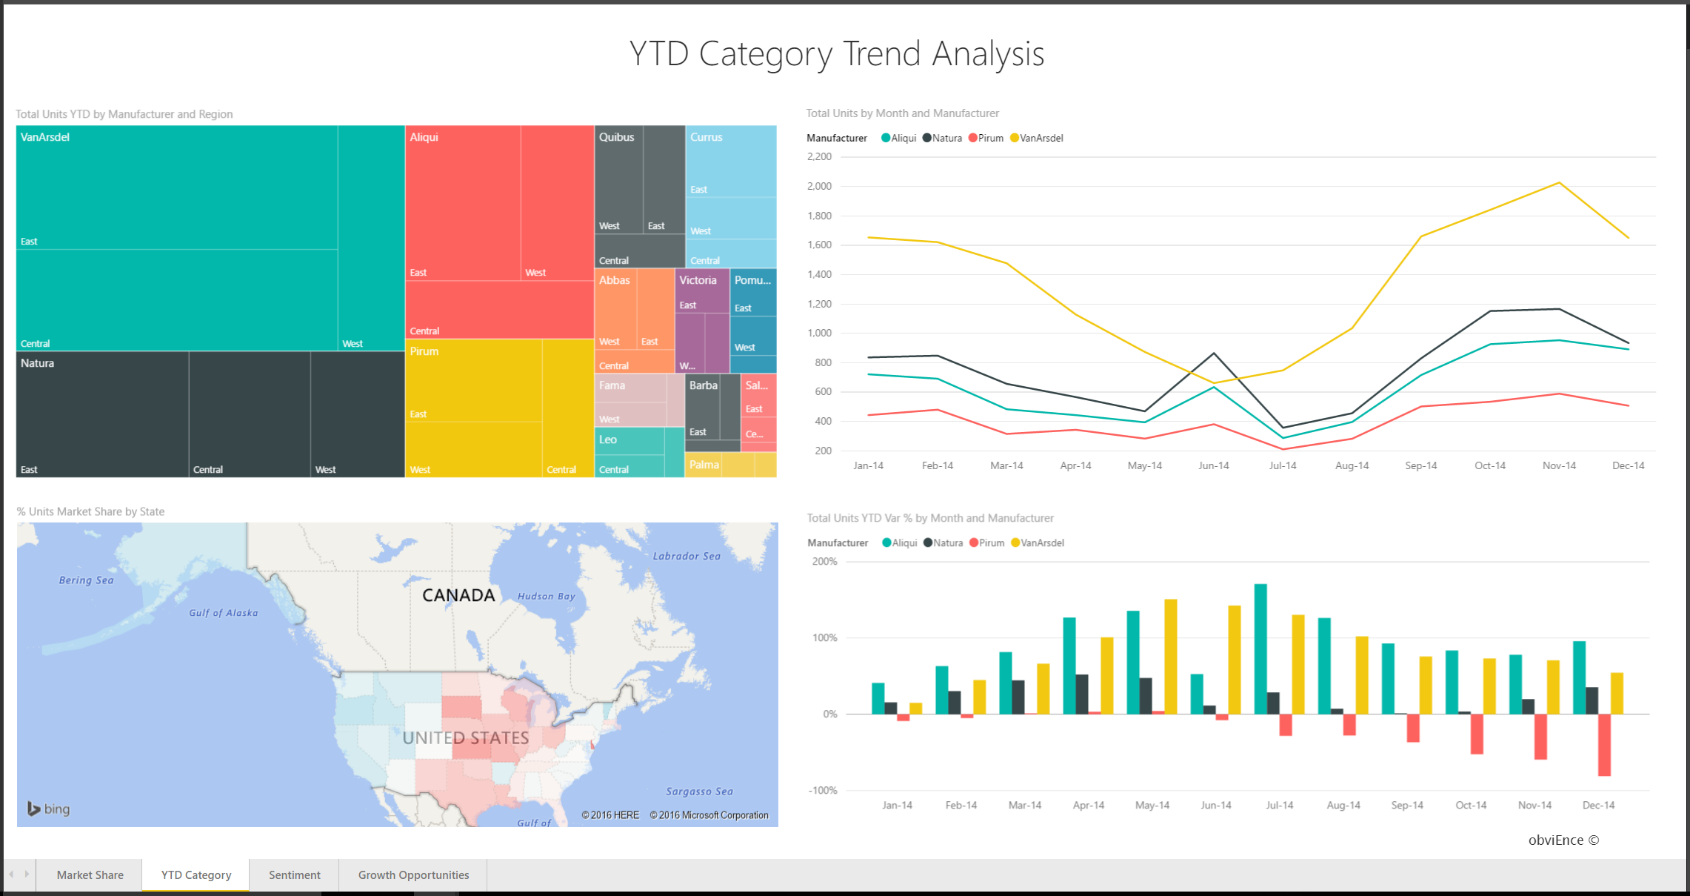
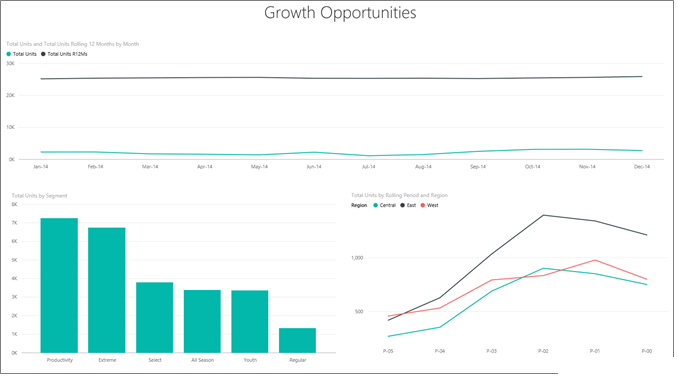
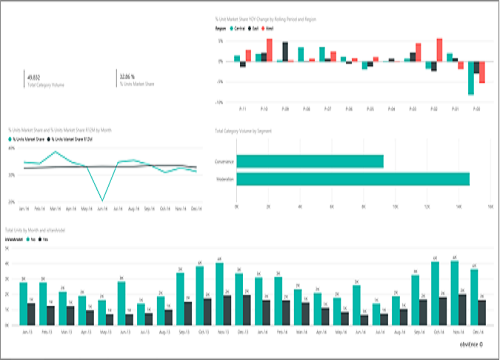
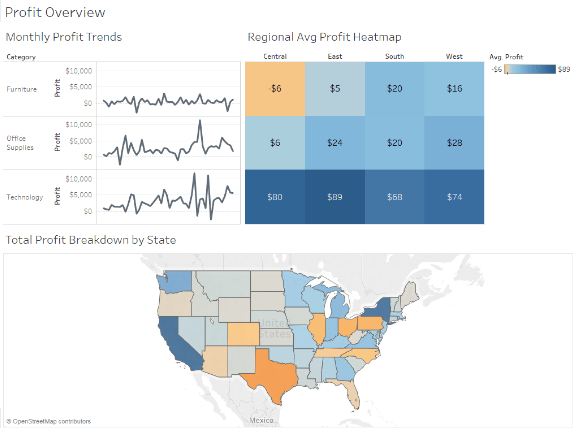
  • With large product portfolios, keeping an eye on the big picture can be difficult, especially when it comes to changing customer demand. Customer surveys are one great way to stay in touch with buyers. This dashboard shows results by state, marketing costs, and customer interest. It also demonstrates the possibility of predicting when a particular trend will start to decline so you can optimize marketing and R&D allocations more proactively.
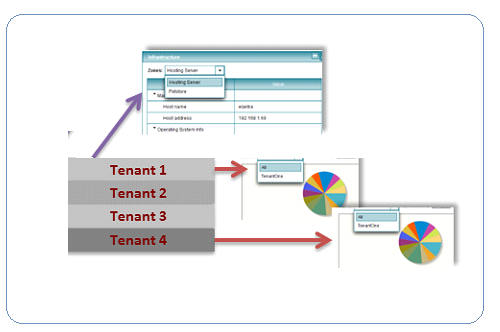
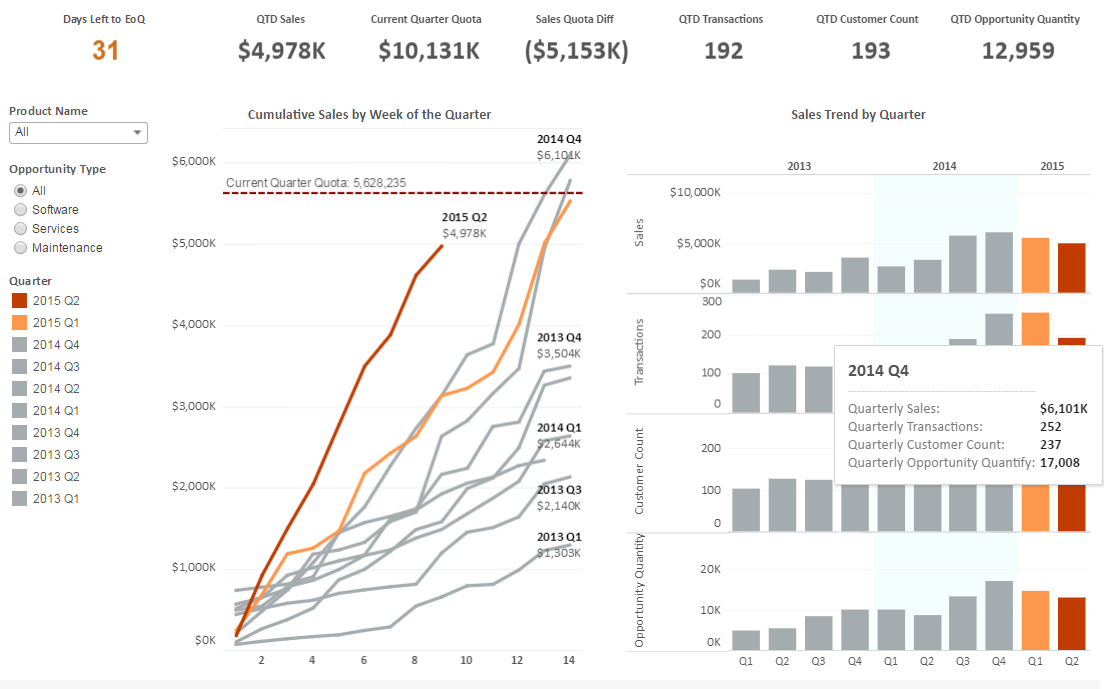
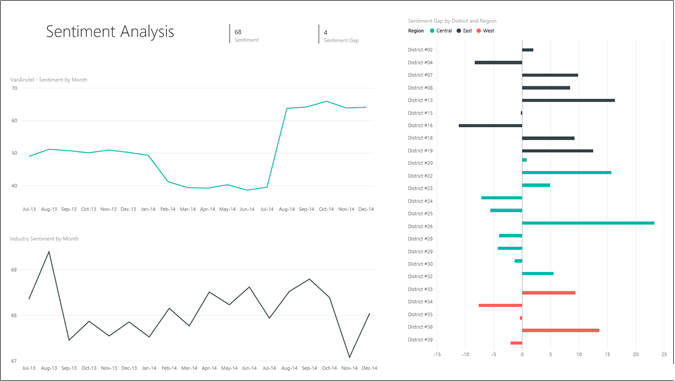
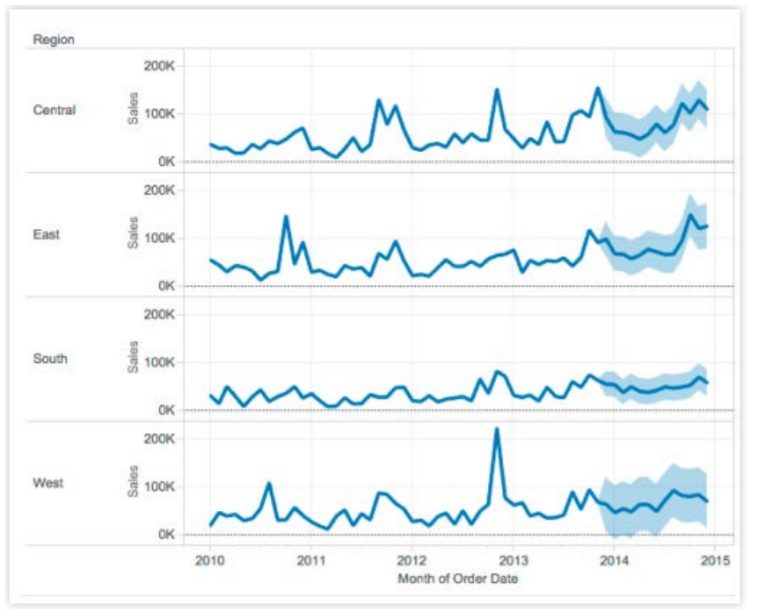
  • When performing a what-if analysis, it allows to change the base value of a calculation, redefine a quota, or set initial conditions. Parameters in this system make this an easy task. By defining a parameter, it can provide a way to change the input values into the model or dashboard. Parameters can drive calculations, alter filter thresholds, and even select what data goes into the dashboard. With Sets, Groups, drag-and-drop segmentation, and Parameters, this system makes it possible to move from theories and questions to a professional-looking dashboard that allows even no experts to ask questions and test their own scenarios
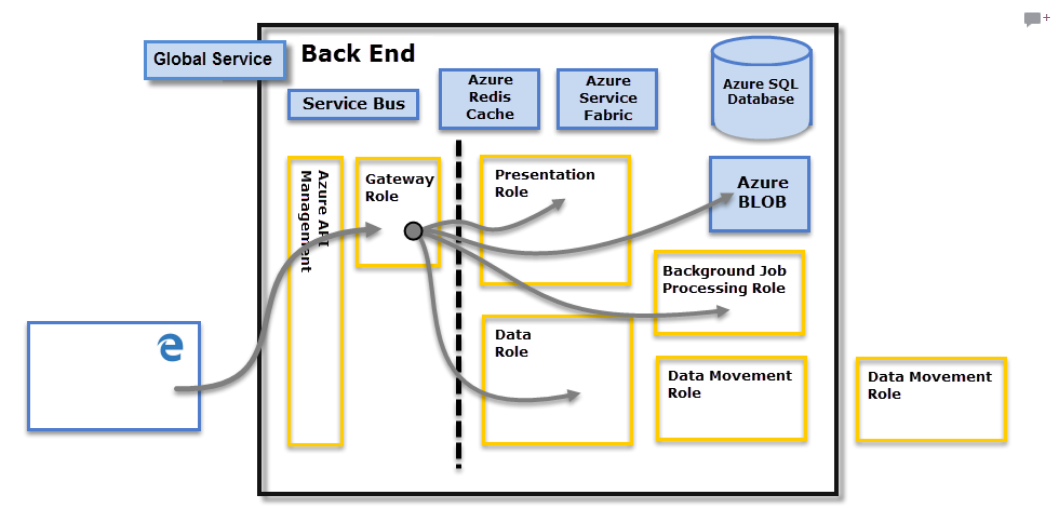
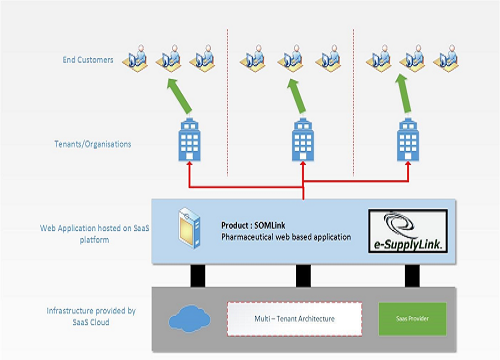
  • This system was hosted on Amazon AWS infrastructure. Application environment was setup on Amazon from scratch. Setup of Linux sever, IBM Informix on redshift, MS SQL Server on RDS. Amazon CloudFront, EC2, RedShift are also used in this project. Configuration of IAM users, public-key cryptography to secure the login information using key/pairs, EC2 Security Group, geographical regions, VPN configuration.

Benefit Impact on Business :

After having executed the application in the production for a quarter, client send the feedback saying ‘The dashboard created by you saved our massive amount of time of resources and hence, increasing the business growth nearly by 20% while also increasing the relevance and accuracy of the data presented. We wanted a BI tool that was quick, affordable, and cost effective. Something that would allow us to connect to a data source without any help from an IT department. Other tools were very cumbersome. Your solution was very easy-to-use. ’

Major Focus Points :

Database procedure and functions were created to perform the backend statistical calculation and hence, enhancing the dashboards responsiveness.
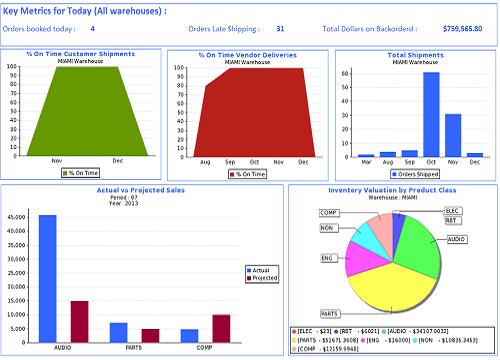
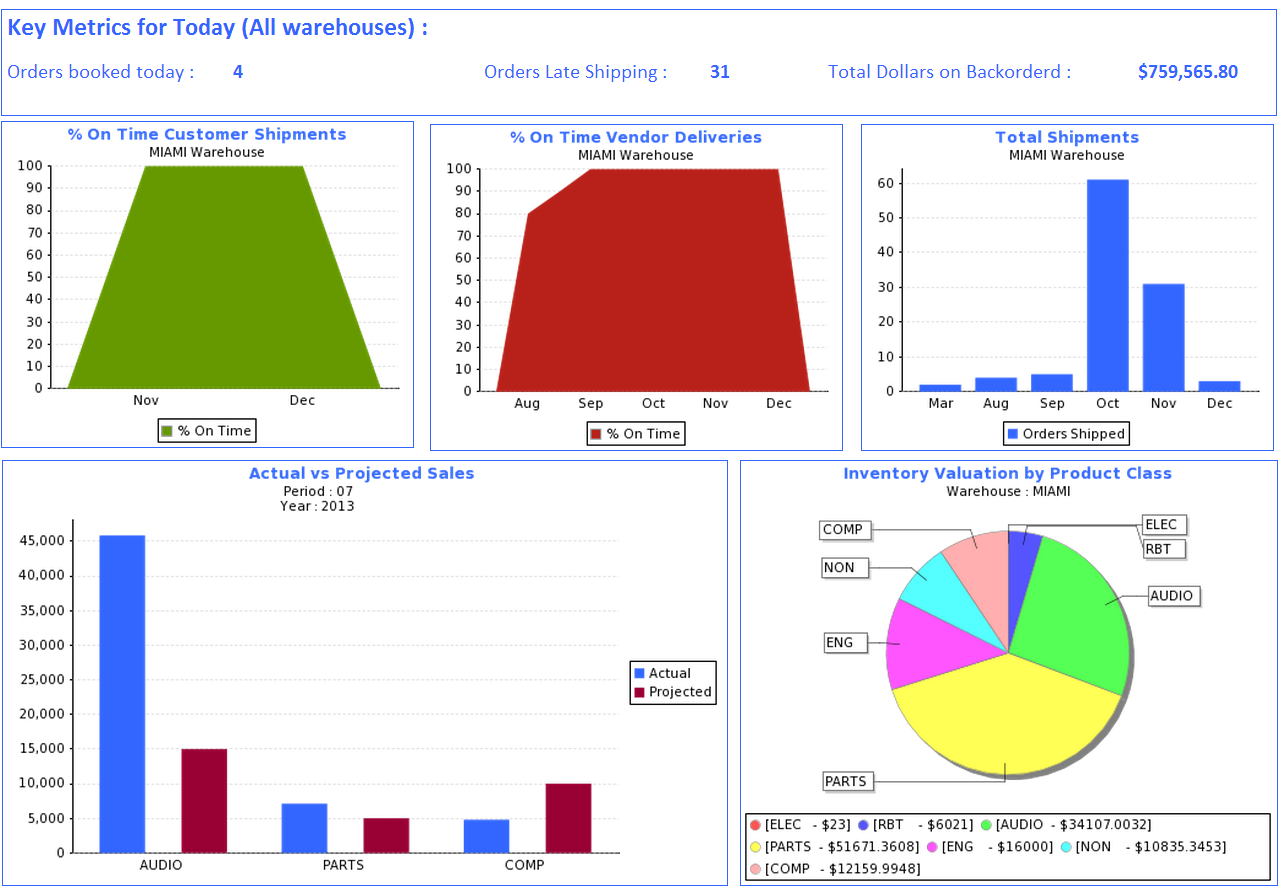
Major key performance indicators of the dashboards are :

  • % on time shipments to Customers
  • % on time delivery by vendor
  • Total sales orders shipped by month
  • Sales- Actual vs Projected by product class
  • Inventory value by product class
  • Key metrics for the day: booked orders, late orders, $ backorders
Standard algorithms used to provide encryptions & decryptions of the sensitive data. Primarily, SHA is used in this application to provide data security.
Used resource bundle or equals, for complex SQL expressions. It make easier to switch to another DBMS in future.
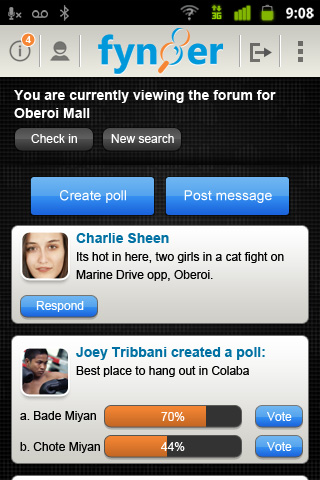
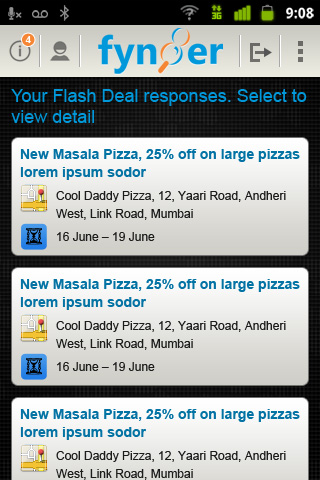
Mobile Support for Android devices

Job Reporting Management System

Client : EQUIPNOU SL
Project : Job Reporting Management System
Industry : Consumer Services, Construction
Application : Web Application, Mobile App (Android)
About Project :

There are several small to medium agencies or companies in Spanish area which deals in consumer services business. Few instances of the services provided by these companies are: Swimming Pool Maintenances, Garden Lawn Cleaning, House maintenances, Plumber work, domestic helps (on hourly basis), cabs facility, travel assistances, luggage transportation and various other kinds of services. In all these services, consumer is directly involved to convey the needs of the service and direct the service the way it require.

On need of any kind of service, consumer directly call one of these agency/company (which provides the relevant service) and that agency assign the person or team of people to fulfil the consumer’s service. The assigned person or team visit the service’ location, performs the job, takes the feedback from the client and submit the report to the agency. This is the complete job cycle to complete any consumer service, however there can be several other tasks can also be involved in between.

All these operations involved in providing consumer service were being managed manually where the assigned resource was creating the paper based report, filling up the paper-form, getting the customer feedback and then manually submitting the paper report to the agency. This kind of manual handing was not at all efficient and consuming lots of efforts in terms of resources time and engagement to complete one job. Also, it was not directly apparent or trustworthy way to know the resource location who is assigned to perform the job, what time the resource went to location and when the job was finished.

What was needed is a complete package of online and automated system which can override all these manual operations of consumer job handing and should function based on the user type.

Major Functional areas :

  • System with the features based on various user types and relevance
  • Single system supporting diversified nature of businesses of the various agencies/companies and providing uniqueness with adjoining only those functionalities which are needed by the respective agency/company
  • Automated Reporting Management with online form which also include consumer feedback
  • Remote monitoring of resource’s location with the timings intervals
  • Onsite report submission with the support of real time images, signatures and other details
  • Customizable interface to support the modifications of the report forms as per need without any IT person intervention
  • Interface at agency/company level to view all the reports submitted by the resources
  • Email Notifications
  • Functionality in the application to view the live locations of the resources working in the consumer location in the forms of maps
  • Internationalization support

Major Challenges :

  • Finding a way to manage various agencies/companies of very diversified natures of businesses and bringing all of them in one umbrella while keeping their uniqueness intact and not mixing up one agency/company requirement into another. For instance, ‘Organization A’ deals in services and ‘Organization B’ deals in construction. As the nature of these organizations are different so the application usages. ‘Organization A’ would need different functionalities and ‘Organization B’ would need different functionalities.
  • Onsite report submission as it was not possible that the resource is always connected to internet and hence, in this case it was require that solution should be capable to handle this scenario

Solution Description :

Solution Approach
To comply with the diversified nature of various agencies/companies and to support distinguishable customize feature and functionalities, multi-tenancy design principle is used in this solution. According to multi-tenancy, each tenant (organization) will see the application in the way that it has been customized solely for its usage only. However, at the same time another tenant (organization) would see its application in its own way, customized based on its business nature.

Possible users of the application identified as :

  • Resource, the worker who will be performing the job of consumer
  • Admin, system owner (Equipnou SL) who will have the functionality to create and control the accounts of various agencies/companies
  • Agency/Company coordinator, a user who will be managing overall operations on organization behalf, responsible to create end-customers, tasks, inspecting and managing reports, products etc.

After scrutinizing all the usages and through analysis, it was decided to have 2 kind of applications in the system: web and mobile. Mobile solution was chosen for the resource who performs the on-site job and most of the time works remotely so having the app running in the mobile can increase the ease of use by simply operating the app with the feature of filling the and submitting the report remotely. It also helps to send the current location of resource to the coordinator. For admin and coordinator, web solution with 2 separated interfaces was chosen who can manage the overall operations individually. Admin can create and control organizations while the coordinators can monitor the resources and manage their own organization respectively.

REST based architecture was implemented for Mobile App services. Java was chosen as the programming language for server backend which processes the requests coming from Android based mobile app. PHP based technology stack was chosen for implementing web interfaces with MySQL as a database server. For location tracking and remotely monitoring the resources location, Google Maps API was used.

There are 3 parts of this project:

  • Implementation of Web based Interface with 2 separate interfaces for Admin and Coordinator
  • Implementation of Android app
  • Implementation of Web services based Server backend for Mobile App

Solution Specifications

Details on project specifications are as follows:

  • Multi-Tenancy Implementation - All organization specific customizations are implemented in the way so that it feels that every organization is using unique application developed for their usage only and most importantly, not a single conflict has every occurred between the usages of other organizations i.e. each account runs in isolation and does not share any data with others, each account has its own secure data store which can only be accessed by the intended organization. True multi-tenancy principle is applied in the system which allows complete flexibility and ease to define or modify the properties for the organizations anytime without any manual intervention. Changes applied for one organization does not impact others.
  • Organization Management - Each organization assigns a coordinator working on the application and handling daily operations. Each organization has access to view/edit data only which are relevant to their organization and they cannot view/edit the data for any other organization, this allows to manage the transparency and data integrity. They can access only own set of reports created for them. Each organization will have workers who will be doing job work for organization’s consumers and reporting back to organization. Account for each organization is setup by the administrator (Equipnou SL) with the required settings and customization as per the organization needs.
  • hFCM (highly Flexible Configurable Maintainable) - The foundation of this solution is based on hFCM principle – highly Flexible Configurable Maintainable.

    Flexible - The exquisiteness of the application is flexibility, configurability which allows it to modify or transform the features anytime with the ease of few user interface navigations. For instance, let’s take an instance of Products Management. Every organization provides different products which varies in nature. Products from different organizations will have varied fields which are uncommon from each other, the application can manage the schema to represent multiple products fields of various organizations.

    Configurability - All the business fields for products, tasks, workers, clients are developed in the way that, there are so dynamic in manner that the basic property of these fields can be modified anytime without any impact on the functioning of the application. The basic properties as shown following, can be changed seamlessly by the administrator. There are more than 15 properties for every field which can be controlled dynamically.
    Field Name
    Field Description
    Field control type (text box, combo box, check box… etc.)
    UI Validations
    UI error messages

    Maintainability - Maintaining the application or enhancing the features in the application are no more complicated process in this solution. The framework of the application is highly robust and capable to trace out the issues or problems intelligently and inform them via logs. Enterprise logging mechanism is in place which traces all the events occurring in the application in sophisticated and structured format that makes it easy to read by anyone.
  • Application provides the means by having the way in the interface where all possible form fields of various functionalities like – products, tasks, resources, reports etc. are defined and the administrator of the application can chose from those fields while setting up the new account for the organization. A list of all possible fields appears on the screen during the setup of organization and admin can chose require field based on the organization business nature.
  • Application has the provision to modify the form fields selection for all features from the organization’s account anytime with no developer intervention. Administrator has complete control to create/modify the configuration of organization’s account.
  • Adding new field not present in UI - This is uniqueness of the application which allows direct embedding of new fields which are not present in the UI but can be added seamlessly without any code level changes or developer help. New field can be added from separate administrator panel application by just following few UI navigations, and new field will immediately appear in application. So, for instance, if requirement is to add ‘Product date’ which is not present in the application, it will just require to follow few UI navigations to add it.
  • Reporting is one of the core business objective of the application. The design strategy of the reporting mechanism allows to have various formats of reporting based on the organization’s business nature.
    The Mobile App of this solution has the report form which is used by the resource of the organization to submit the work report from the mobile. The structure of this report form is completely flexible and configurable which can be modified anytime without developer’s intervention, it is controlled by the administrator of the application.

    Reporting Structure - The structure of the reports are defined by the administrator at the organization level during the time of account creation or can be defined later also. This structure defines the fields declarations that appears on mobile app. There is a interface which presents all the possible reporting fields based on the organization’s business nature. Administrator can chose from these fields while defining reporting structure for the mobile app, the fields declared in this setup are appear exactly in the mobile app.
    There is also a provision the reporting structure once defined, can be updated anytime with the new fields without any developer help and they will be reflected in the mobile app without any further action. This is the powerfulness of the solution, that the control of mobile solution is in admin’s hand and can update it whenever needed.

    Reporting Template - When the resource submits the report from mobile app, the report is transformed in the PDF file format, consolidating the report structure in the PDF tabular form with the organization’s custom settings. This format of PDF file is based on the template as per the organization’s business needs. Multiple templates are provided in the system and administrator can chose from one of them to associate with the organization’s account. This template is then used as a foundation to create the PDF file for the reports. The template linked with the organization account can be replaced by any other template anytime.
  • Syncher Service – Syncher is the feature which keeps the mobile app in sync with the server and keeps the data updated when requires. This is the important feature which always keeps the mobile in sync with the server and the server is always aware of the app functioning’s.
    If there are any updates in the products, like, new product added/removed/modified or even the product fields are updated by the administrator they will be reflected on the mobile app via this service. There is no external action required to update the mobile app in order to maintain latest changes, it will automatically be taken care by the solution.
    Similarly, updates in the reporting structure like report fields added/removed/updated are synched with the mobile app via this service. Once the reporting structure is change on the web front there is no action needed from administrator side, it will be automatically updated on the mobile app. Worker on the mobile app will always see the updated reporting structure.
  • Another powerful feature is streaming the data in bytes. All the dynamic data in the mobile app which is updated via Syncher service, or images uploaded in the report form, or signatures etc. are stored in bytes form which is uniform for all. Saving the data in bytes form reduces the storage requirement in mobile and hence makes the app lightweight. It also saves the bandwidth requirements while communicating with the server. Streaming the data in bytes also adds the flexibility from maintenance perspective which allows to let the data convert into any format based on the nature like image, file, binary, text etc. The nature of the format can be changed any time and it would not require any changes in mobile app.
  • Non-Connectivity of Mobile App - The scenarios when there is the possibility that the mobile app is not connected to the internet and unable to communicate with the server is handled in this solution. This is taken care by the Syncher service and the Reporting service. These services runs based on the configurable time intervals and checks if the phone is connected, when the connectivity is found, they sync up with the server for latest changes.
    In case of report submission, when the connectivity is not available, the report is saved as a draft in the mobile app and sent later when the connectivity is found. Worker of the mobile app gets notified when the app dispatches the report.
  • OTA (One Time Authentication) - As this solution supports multiple organizations and these organizations can have many workers, and in turn, these workers will have mobile apps installed in their mobiles. Now, the questions comes up how to identify which worker is associated to which organization and how to identify the authentication of the worker, it may possible that worker is no longer exist with the organization or it’s a unauthorized user.
    The solution for this problem is implemented in the form of ‘One Time Authentication’. OTA works at the time when the worker launches the mobile app first time, it asks user to enter the organization name to which it belongs and the worker name. Once these information is provided, app communicates with the server to authenticate this data. Server, in turn check the authenticity of the data and returns the authentication results. If the authentications fails, then the worker will not allow to use the mobile app. If server passes the authentication details, then it will create a unique token key for that worker and will return that to the mobile app. On receiving the token key from server, app will allow the access and will store the token key internally. This token key will be then used for all ongoing communications with the server which helps to know the identification of the mobile app requests. The token key is unique in the nature and belongs to only single app.
  • Search functionality – Data can be searched and filtered based on the worker name, consumer name, task status. Various Search Criteria’s to filter out the report data, View the results in structured data table, Export the filter results in CSV or XLS format. Calculating total no. of hours spent by the worker for the client.
  • Dashboards – Web interface also includes a dashboard which highlights the summary of the organization activities in various sections. Its shows the Tasks status and reports submitted in the calendar year in graphical view in the form of graphs.

Benefit Impact on Business :

This new system bring the finest results for the business and over exceeded the expectations, in just one quarter the no. of clients (agencies/companies) increased by 8 times. The reporting functionality developed in this system was highly recognized, the automated mechanism of report submission saved the vast amount of manual efforts by 300% and hence increasing the revenue by an average of 38% for all organizations which were associated with this system.

Online and instant submission of reports from the mobile app increased the rapidness in the process of servicing the consumers and they can also know their consumer’s feedback spontaneously. This allows the organizations to serve more consumers by the same strength of resources in minimal time.

Major Focus Points :

Service Oriented Architecture
Bringing multiple organizations of diversified business’s nature under one umbrella and operating them uniformly without hindering other organization’s business nature
Handling non availability of online connectivity in mobile app
Unique feature to allow run time customization of any form field (add/modify/delete) in the UI without any code level change
Remote monitoring of the resources
Highly customizable Reporting structure that allows to have varied formats of reporting based on the organization’s business nature.
Reporting form in the mobile app supports camera shots, photos, location, consumer feedback and signature. This report with all its components can be uploaded at once on server.
All control elements (text box, combo box etc.) in reporting form in mobile app is based on the set of syntactical format which is configured from the web interface and rendered on run time. None of the control elements being rendered in the mobile app has any code written for it, the code for them is created dynamically on run time.
Interactive and formatted report generation as per the respective organization business nature
Internationalization of the application in Español and English
Mobile App development based on native OS implementation. This app is able to download and installed inherently in the mobile OS system. The front-end design of mobile is based on UX design

Calls Records Management System For Telecommunications

Client : Connected (www.callconnected.com)
Project : Calls Records Management System For Telecommunications
Industry : Telecommunications
Application : Business Intelligence & Reporting Management
About Project :

The requirement was to create a Report Management system to generate automated reports in various categories like, Customer Call Details records, International call records, Toll free call records, PBAX details, Invoice generation etc.

Major Functional areas :

  • Data was becoming more complicated with each transaction on our client’s online portal and Handling million no. of records was the challenge
  • Reporting system was not in place to identify the revenue stream and design a focused marketing plan
  • Various query filters, like: cost, name, duration, caller id, source etc. required to filter out the data in reports
  • Enterprise Reporting platform was required that could keep data formatted and organized
  • Strong requirement to reduce the traffic calls to customer care

Solution Description :

With usability and reporting objectives in mind, visualizations were designed that plotted data so that their different attributes, trends and correlations could be easily understood and analyzed. These reports were designed by querying and deploying data onto cloud-based infrastructure. The reports can be accessed on-demand anytime and anywhere through a secure web interface. Reports can also be scheduled or triggered by events, and distributed via email.

Web-based report solution simplified the client’s IT management by centralizing reporting infrastructure. It also improved scalability and accessibility. The client gained better insight into their revenue sources.

Details on project specifications are as follows:

  • The solution includes the report server environment, enabling clients to schedule standardized reports or request them on-demand, as well as the graphical designer which enables clients to define their own, customized reports. Clients can also build and execute ad hoc queries—and every form of output is created with real-time, transactional data.
  • Also built a real-time server component that populates the data from the core data stores in a relational database Environment. These data, which can also be incorporated into reports and queries, is near-real-time. Customized data services allow reports to combine both types of data within a report or query. Recently, a new data and reporting service was added to integrate risk analysis information.
  • The online analytics (OLAP) solution is also part of the mix. Had also created analysis cubes—specialized, analysis-tuned data structures—for investment business data mining.
  • Designed normalized cloud database schema

Benefit Impact on Business :

Previously, the customers used to call frequently to customer care service to get the information about the details of their calls and other relevant details. Due to the high traffic of query calls, the investment on the resources (manpower, infrastructure) had to keep increasing to cope up the high traffic call hence, impacting on the expenses which was declining the profit.

After the implementation of reporting management interface, the traffic calls was get decreased by 65% resulting into great positive impact on the revenue and profit which was diagonally increased upwards.

Business Marketing/Promotions Application based on Social Networking

Client : Fynger Mobility
Project : Business Marketing/Promotions Application based on Social Networking
Industry : Retail, Social Networking, Business Marketing
Application : Service Oriented Architecture, Web Application, Search Engine, CRM, Mobile App
About Project :

The primary objective behind the idea was to provide ‘Business Marketing with promotional offers via Social Networking’ aiming to seamlessly bridge the gap between buyers and sellers, information seekers and providers and make life a tad easier for people on the move. Fynger helps to communicate with the existing and prospective customers in real time. It gives the power to push deals to specifically those who are looking for certain kind of product or service.

Major Functional areas :

  • Flash Deal – A feature that allows merchants to communicate with the consumers in real time.
  • Search Engine – Based on the key word and location
  • User Location identification based on Google Maps API
  • Chat Mechanism
  • Facebook Integration
  • Highly secured user authentication
  • Email notifications
  • Mobile notifications on Android/iPhone
  • Ratings & Reviews of services/products

Solution Description :

Solution Approach
The target of this application was to reach all kind of consumers using online mechanism, be it web or mobile. It was also important to consider the facts that the application should not be heavier and should work simultaneously and uniformly in all platforms. Uniformity was the main point of this project, so that new change apply in the code should work in all platforms without any compatibility issues.

Considering all these facts, REST based architecture was chosen to implement this project and all the business functionalities were envisioned to be developed in the form of web services so that can work uniformly in any kind of platform.

There are 2 parts of this project:

  • Implementation of Server backend
  • Implementation of Android and iOS application

Solution Specifications
REST architectural principles based web services were implemented to process all the business functionalities. Each functionality works as a service which can be called by any kind of interface (Service Requestor) either web or mobile. Application was developed for web platform and for mobile platform (Android & iOS).

Details on project specifications are as follows:

  • Java was the core technical language for this project while SQL Server was used as a data store
  • More than 50 services were developed in this project. These services provide many functionalities to the web channel application like, User Login & Profile service, Search services – Listings, Promotions, Flash Deals, Social connectivity services – Group walls, Google Place forums, chat, Facebook integration etc.
  • Search engine was developed to find out the results based on the coordinates of the user. This engine returns the result of listings, promotions and flash deals which are based on desired input of user. It was developed on Apache Solr.
  • As a part of this project, implemented a complete chat server based on XMPP protocol. XMPP is Extensible Messaging and Presence Protocol which is an open XML technology for real-time communication, which powers a wide range of applications including instant messaging, presence, media negotiation, white boarding, collaboration, lightweight middleware, content syndication, and generalized XML routing.
  • The only use of XMPP protocol in this application was for instant messaging. The chatting feature also provides the feature of file transfer. The implementation of Chat feature was based on the client/server architecture where the client as a user will send text/file to the server and server in turn, send the text/file to the intended client or user.
  • The design of this application was fully modularized, scalable, highly configurable by changing XML files or updating database configuration files, robust performance and given scrutinize consideration on the extensibility and future maintenances.
  • Openfire XMPP based Chat feature implementation. XMPP is Extensible Messaging and Presence Protocol which is an open XML technology for real-time communication, which powers a wide range of applications including instant messaging, presence, media negotiation, white boarding, collaboration, lightweight middleware, content syndication, and generalized XML routing. The chatting feature also provides the feature of file transfer. The implementation of Chat feature is based on the client/server architecture where the client as a user will send text/file to the server and server in turn, send the text/file to the intended client or user.
  • Email Alerts Management component implementation
  • Push Notification implementation - GCM (Google Cloud Messaging) APIs were used for Android users and Apple Push Notification System (APNS) were used for Apple users to send notifications on user’ mobile.
  • Google Maps APIs were used to for location based services to identify the coordinates.
  • Custom Thread Management component developed which controls all the threads of application. On server shutdown, this class gracefully terminates all the running threads. It waits for any thread which is in middle of any operation to let it complete the operation to avoid any unwanted results or incorrect database related transactions. This component was based on Executor framework of Sun Microsystems.
  • Custom exceptions are implemented for each web service type that extends the main custom exception. Each custom exception signifies the web service type and the associated exception. In case of any business validation failure or any relevant exception/error is occurred then the corresponding exception is thrown back to the calling resource request handler. On receiving the exception, resource request handler generates the error response object which is transformed into XML by the JAXB component. This XML is then send to the client wherein the client extract the error details and perform the appropriate action.

Major Focus Points :

A comprehensive and very detailed technical design document was created for this project with architecture and UML diagrams and it was highly appreciated. This document incorporates all the granular details of the application workflow, class/sequence diagrams, schema design and several other aspects of project implementation.
Apache Solr Engine used to implement custom searches. The data communication between the Web service system & Search System is based on the object sharing mechanism.
Monitoring and Auto alert management for observing any unexpected issue and report it to the support team via email with full description of the event
Instant Chat messaging management system with admin console
Highly optimized and normalized database schema design to handle hundreds of requests simultaneously
Lightweight architecture so that can be installed on mobile app natively and interacts seamlessly with the web server without any performance issues

Digital Marketing and Advertising based on Email Campaigns

Client : Ghirardelli Chocolate (www.ghirardelli.com)
Project : Digital Marketing and Advertising based on Email Campaigns
Industry : Retail
Application : Digital Marketing
About Project :

The requirement was to develop an automated system that can manage marketing campaigns and can track the web analytics. The concept was based on the digital marketing where the end consumer will register into the application during the product promotional period and will receive automated periodic campaigns in the form of user friendly emails. These campaigns are personalized based on the end consumer likes and dislikes which is tracked based on their browsing history and the data they filled during the registration.

The application should keep tabs on every email campaign and transactional send, with real-time tracking and graphical reporting. It should monitor what all links inside the email campaigns were clicked and how many times, also track if the user has opened the email or not. All the possible data tracked by this system is used to create a comprehensive analytical report that can be used to boost the ROI of the product.

The application is also intended to connect with social media to know what the customers are sharing about the product with their social network. This application engages with customers, and use social insights to drive marketing decisions.

These digital campaigns required to be fully responsive to work on all type of devices, platforms, browsers, operating systems.

Major Functional areas :

  • Digital marketing campaigns based on consumers’ routines
  • Personalized marketing campaigns
  • Automated and periodic campaign delivery at users’ email
  • Mobile and other devices responsive
  • Web & Data analytics
  • Tracking email campaigns
  • Social engagement tracking
  • Statistical report generation
  • Dynamic Email content
  • Integration of ExactTarget with the web application

Solution Description :

Salesforce’s Marketing Cloud also known as Exact Target is used as a base platform in the project, all advertising campaigns are built on this environment. This solution also able to monitor Facebook and Twitter posts. Marketing campaigns created in this solution are compatible in all platforms : web, Android, iOs, tabs etc. To provide the custom visualization and dynamic data processing, Apex is used as a programming language in building campaigns. High consideration is given on image rendering to optimize the performance.

Details on project specifications are as follows:

  • Seamless integration of ExactTarget with the web application – Fuel APIs of ExactTarget are used to integrate the application with ExactTarget. SOAP web services are used to exchange the data between two.
  • AMPScript is used to develop the core components and to provide desired customization in the emails
  • Social Forward - Social Forward is used to enable email recipients to share content from emails with other users via their preferred social network. It also tracks any clicks from an email to a social network and the resulting page views from the URL shared by the email recipient.
  • Data Extension and Data Relationships – Used to satisfy the need for flexible data storage in the application.
  • Triggered Mails - To provide automated, personalized responses to the customers' activities on the website. Emails are trackable, targeted, and sent in real time.
  • Data Tracking – Data collection that allows to view critical elements such as email opens, clicks, undeliverable, and other metrics online. It also supports, how many emails were forwarded and how many new subscribers each forward generated. This strategy allows to track specific feedback on the individual consumer's preferences and habits.
  • Data Extract – Implemented to export the tracking information from the application database. The application exports the data to a CSV file, compresses the data into a ZIP file, and makes the file available on the enhanced FTP server.
  • Mobile and other devices compatible – The code and design is implemented in responsive way to keep the emails resolution compatible based on the device. The design is platform agnostic and work seamlessly on any operating system, device and browser.
  • A/B Testing – It was performed to determine which version of the email receives the highest click-through rate or highest unique open rate. It helped to optimize the email campaigns to deliver more targeted and relevant messages to the consumers.

Benefit Impact on Business :

In a short duration of just 1 month period, after releasing the automated campaign management, the web site traffic was noticed to be increased by 30%. And after 2 months duration, the sales graph was surprisingly roared up by 40% for the products that was being advertising via this system.

Major Focus Points :

Sending millions of emails in few minutes
More than 50 email campaigns were built and integrated into the web application.
Journey Builder mechanism used in campaign management
Granular level of tracking and analytics

Customer Orders Management System For IT Network Securities

Client : YDeal Inc.
Project : Customer Orders Management System For IT Network Securities
Industry : IT Network Securities
Application : Web Application, Email Spams Validation, Security
About Project :

Web-based email validation service & Web Based Customer Orders Management System was required that allows users to upload and validate lists of email addresses and manage their orders thoroughly. User would be able to check their files, folders, able to add/update/delete files from the system. Integration of Payment Gateway system, accounting system for transaction summary.

Major Functional areas :

  • Admin portal
  • Email Notification management
  • PayPal payment gateway integration
  • PDF report Generation for transaction receipts
  • Excel reports generation for validated emails
  • FTP file processing
  • Thorough Email Validations
  • SEO Implementation
  • Highly scalable to handle thousands of users

Solution Description :

This application is based on PHP development language and data store resides in MySQL. PayPal gateway system was integrated for online payments. Business reports were developed to provide various details in structured format for different business users. Email management is another major functionality developed using Swift APIs.

Details on project specifications are as follows:

  • Order Status Management – More than 15 statuses of the orders lifecycle handled which can be modified on frequent basis by the customers and system is quite efficient to manage them. Sending mail notifications on status change event was the most complex part of the application. Inside the order status, there are individual statuses of apple, demo, delete, time activations, image changes etc. Handling them was the most challenging task of this application.
  • Promotion Management for the product order. Multiple promotions were managed and were based on no. of units, discount. Promotion can be activated/deactivated any time and hence reflects the changes at end customer side.
  • Customer Order Screen - Designed the functionality for the end customer to see the details of all orders in single screen. User can see the interactive visualization and the progress of the order. User can check the payment receipts (PDF files), validate mail excel files, delete the order.
  • Reporting Management - Reports generation in various categories. Displaying them on the screen and downloadable in Excel and pdf formats. Reports can be sorted based on the filters.
  • PayPal Integration - PayPal Advanced payment API implementation for Express Checkout & Credit Card
  • Various Email Notifications – Email engine implementation based on the event triggering
  • Automated order status updation and send mail notifications without human intervention
  • In-depth Email Validation - This comprehensive email validation system includes the following tools:
    Advanced syntax verification, following the most up-to-date Internet IETF standards
    International domain/mailbox checking
    DNS validations, including MX record(s) lookup
    Disposable e-mail address (DEA) validation
    SMTP connection and availability checking
    Mailbox existence checking, with grey-listing and temporary unavailability support

Major Focus Points :

Google Analytics incorporated to track and analyze the usage of application
Secure authentication system based on OAuth
Highly Scalable to handle large no. of users
MVC based architecture with loose coupling and high cohesion

Classifieds Web Application

Client : EJR Associates
Project : Classifieds Web Application
Industry : Retail, Classifieds
Application : Web Application
About Project :

A classified advertisements web application was envisioned with sections devoted to multiple categories like jobs, housing, for sale, items wanted, services, community, Resumes, etc.

Major Functional areas :

  • Search engine implementation to find out the results based on the string entered by the user
  • Display results directly on the map
  • User Management
  • User Accounting
  • Reporting Management in form of PDF and XLS
  • Customized Mailbox
  • Posts management (Add new Post, Delete post, Renew post, Edit Post, View Post, View Messages)
  • Bookmarks
  • Email and SMS Notifications
  • Alerts management
  • Online Chat server with audio/text/video messages
  • Admin Panel
  • Web Analytics using Google Analytics API
  • SEO Implementation

Solution Description :

This application is based on Java development language and data store resides in SQL Server. Google Maps API used for maps navigation and location controls. Business reports were developed to provide various details in structured format for different business users. First Data Payment Gateway used for online payments. For text messaging GCM (Google Cloud Messaging) used for Android users and Apple Push Notification System (APNS) used for Apple users.

Details on project specifications are as follows:

  • The geographical map was the center of the application. All results has directly embedded on the map with as much as possible information in brief & long description formats. Addresses with full description were marked in the map directly with designed icons.
  • The site employed analytics to capture data for each instance of subscriber access to optimize marketing parameters and to monitor general site performance.
  • One of the objectives was to provide a portability structure such that one would be just as comfortable with using their tablet computer in another city and logging in to the application to access posts that would be in the current surrounding area.
  • Service providers has an feature to enjoy an authentic rating system that is governed by internal algorithms to prevent falsified referrals and ratings.
  • Accounting Management – Screen to list the transactions spent for displaying advertisements on the application. Functionality to export reports in PDF, spread sheet formats
  • Mailbox Management - Customer has the option to view all the mails received by the service providers and sent to them. There are 2 separate screens for Inbox & Sent Items. Customer can reply by just selecting the reply icon from the mail and the same window will be expanded with the text area. There are other several options are present to manage the mailbox.
  • Push Notification implementation - GCM (Google Cloud Messaging) APIs were used for Android users and Apple Push Notification System (APNS) were used for Apple users to send notifications on user’ mobile.
  • Customer has an option to save the search results in the form of bookmark to view it later. Bookmark page also include small map.
  • Best practice security measures has been instituted to protect the network and the site from malicious penetration. Internal automated and manual review was used to verify the validity of posts to the site. SSL (Secure Sockets Layer) layer approach will be used for enhanced securities.
  • In order to recruit qualified traffic from the search engines, Search Engine Optimization was implemented and the number of techniques was considered, that can be used to ensure the MapAdz related pages are indexed and well positioned in the major search engines. Apache Solr APIs used to implement search engine.
  • Monitoring & Error Logging - Application was designed to capture errors and store them in a place that is accessible to the monitoring system. Error codes recorded in the log was able to clearly identify the problem. The error messages displayed to end users may be generic. In the log, detailed error description are stored for events occurring on a regular basis and critical system failure or for multiple types of failure. It helps to identify the issues.

Major Focus Points :

The web application was highly interactive and prompt result oriented.
OAuth based Login authentication, blocking fraudulent users
Data was encrypted in transit as per the standard Sensitive Data Storage, Transmission and Disposal Policies, Sensitive Data Encryption and Key Management Policies, and Encryption and Secure Hash Standards.
Web Analytics/ Reporting was in the place to improve the usability of a site, targeting the designated audience, increasing conversion rate, enhancing consumer experience, as well as increasing lead generation and repeat users.
Maintaining the records of single user entry and exit times, locations visited on the site, actions performed, previous IP’s that were used to access the site, MAC ID of the of the single instance access if available and the type of device used that are all keyed to the registered users ID.
‘First Data’ payment gateway integration
Separate Admin panel to manage, configure, monitor the web application activities
Extensive usage of Google Maps API

Installers Development For Medical Simulation

Client : VisibleEP (www.visibleep.com)
Project : Installers Development For Medical Simulation
Industry : Healthcare
Application : Installers Development, Application Deployment Management
About Project :

Development of an installer for the desktop application. Product name is VisibleEP Electrophysiology.

The basic requirements for the installer are:

  • Windows 7 or later (32 and 64 bit)
  • Must have administrator privileges
  • Uninstaller with Modify, Repair & Remove

The installation process should be performed in two steps: first, the binaries should be installed (the application itself), and second the content should be installed (e.g. text documents, videos, etc.) The reason for the two step process is so that updates may be issued independently for either the application binaries, or the content, or both.

Binaries
The software is packaged with installers for the following pre-requisites, which are first identified if they already exist in the system or not, if not found then only these prerequisites are installed:

  • Microsoft .Net 4.5
  • A set of video codecs – K-Lite Codec Pack
  • Microsoft Expression Encoder
  • Visual C++ Runtimes

Content
The content files should be copied to a sub-directory where the binaries are located. This installation step should also detect earlier versions of the content and remove all previous files before copying the new ones. During the initialization of Content installer, it first checks if any previous contents exists in the system, if it finds any then it will first remove the previous content and then only it will install new one. It does not impact the installation of binary.
This installer search the binary installation in all the drives on user’s computer up to 7 level of directory levels. So, if the binary installer is present other than the standard location of Program Files folder, this installer is capable to locate the binary in other locations as well. If binary installation not found, it will show up an error on user’s screen with proper message and will terminate.

Bootstrapping
Boostrapper installs the binaries and then the content, so that to have a “one-click” installation for new customers.

Benefit Impact on Business :

Before the development of installers, deploying the VisibleEP medical simulation program on customer’s machine was a manual job and was very intricate due to the complexities it involves. It was used to take substantial amount of efforts to make the program work on customer’s machine. Another problem was, due to the distinguish configurations of customers machines, the procedure of medical installation on machine becomes more cumbersome and irregular. Identifying the dependencies (prerequisites softwares for the program) on customer machine was also the challenging task as every time it was necessary to manually run a test for each required prerequisite on the machine to check if its having that prerequisite software or not and in case prerequisite is not present then it also needed to install that prerequisite as a part of manual installation.

These difficulties were majorly impacting on the sales of the program which was constantly decreasing. After the launching of the installers which automated this whole process, the sales volume of the program was increased by 40% in 2 months and customer satisfaction was on high rate.

Major Focus Points :

Creating restore point on install & uninstall
Creation of Start Menu entries
Presence of Control Panel Icon & Comment
MSI & EXE setup
Disk Size check-up
RAM requirements verification
License Handling
Version Handling

Data Analysis & Performance Report Management System For Financial Institution

Client : ABC Finance (Name Confidential)
Project : Data Analysis & Performance Report Management System For Financial Institution
Industry : Banking and Finance
Application : Data Analysis, Business Intelligence Reporting Management
About Project :

ABC Finance provides regular reports that measure its performance to its clients. ABC measures its performance with what they call their Executive Summary report. The ROI percentages that appear in this report are the primary measure of performance for ABC clients. ABC was having their existing system which generates this report. But, report based on this system was taking over 24 hours to process and the resulting 500 page report was inflexible.

There was no way to quickly focus in on a single client or client contract and there was no way to change the level of detail. There was also no way to further analyze the results, e.g. by equity type, so they could discern what portions of their business are most lucrative from investment perspective. And there was no convenient way to validate or understand a sum by examining the detail records that it represents.

What they needed was report information delivered in the form of a PDF or Excel sheet or online web page.

Major Challenges :

  • How to export more than 100 million facts and dimension rows from DB2 to SQL Server in less than 5 hours ?
  • How to transform exported information into a SQL Server data mart with no referential integrity errors ?
  • How to compute distinct counts within the cube that have a different granularity than the basic revenue facts ?
  • How to map the similar facts to multiple members within the same dimension ?
  • What disordered hierarchies should be used as dimensions of the cube ?
  • How to support drill through to facts so that cube aggregates can be validated and comprehensive ?
  • How to make cube aggregates to the General Ledger so that data integrity could be validated ?

Solution Description :

The consensus was to use Online Analytical Processing (OLAP) for this problem. OLAP looked like the answer because it pre-computes numeric aggregations for the cross-product of all relevant dimensions so that summary information for any combination of dimensions can be displayed on demand.

It took about 4 weeks to deliver the first data cube. 2 weeks later, another cube delivered that provided more comprehensive recovery analysis. In later phases, more cubes were developed for Transaction Ledger, P&L Ledger, Balance, Equities Performance, Simplified Ledger and Forecasting cubes in parallel.

Benefit Impact on Business :

The Transaction Ledger and Equities Performance cubes delivered immediate benefits. ABC was using some licensed accounting software. They were not satisfied with the reports that were being produced by this system, but was reluctant to invest an estimated $100K to acquire a new package and train accounting personnel to use it. Instead, they purchased a bridge driver to export data from this system and we built another cube to generate their reports. This saved ABC $100K in accounting software expenses.

Today, their Balance Sheets and Profit and Loss Statements are implemented in an account rollup dimension. They can drill down from a few lines at the top to any level of detail. The drill-down feature is particularly useful in the GL Budget cube. If budget variances are detected at the highest levels, they just double-click on their OLAP table to drill down until they discover the roots of the variance. The OLAP accounting reports reduced the time required to close ABC's books by 5 days. As a result, they can make critical business decisions that are much faster.

Major Focus Points :

Handling more than 100 Million records simultaneously
Crisp Executive summary report which can give high level view in much smaller time
Transforming the large amount of data and making them cube compatible
Scrutinizing the schema of the existing system to sort out the dimensions, facts, hierarchies, attributes, measures, corners
Making the system performance oriented and to be able to work parallel with other accounting software
Understanding the vast content of existing reports and channelizing them for analyzing services

Business Intelligence System For Human Resources

Client : Goldsurance
Project : Business Intelligence System For Human Resources
Industry : Human Resources
Application : Business Intelligence & Reporting Management, ERP
About Project :

Human Resource Reporting system was required for measuring the hiring processes like new hires, active employees, and trying to uncover any trends in the hiring strategy. A kind of pre-built decision support system that helps to analyze and manage all HR processes providing access to accurate, timely, comprehensive data from the HRMS applications and provides the tools to make better, more strategic decisions resulting in faster, better decision-making that aligns the workforce with corporate objectives.

Major Functional areas :

  • Perform comprehensive manpower analysis and budget reports
  • Viewing employee development and performance reports
  • Analyze salary, recruitment, vacancy and termination trends
  • Control staffing efficiency, benefit offerings and labor costs

Solution Description :

Recruiting is a dynamic process as the content is often unstructured and always changing. This process is on-going and managers need to stay up-to-date on an ever-changing recruiting pipeline, integrating content and leads from multiple sources across the web. Keeping all these factors in consideration, the system was designed to enhance recruitment through increased retention levels and reduced turnover and hiring costs. Recruiters can collaborate across multiple business functions and with individual employees. With decreased turnover, higher recruitment yields, and increased revenue, this system provides real-time analysis to help streamline recruitment processes.

Recruiters can now align the recruiting pipeline with organizational forecasts, staying ahead of turnover, and visually interacting with up-to-date indicators and KPI’s on web activity and sentiment. Using advanced workforce metrics, this system empowers users to analyze the skills and performance to maximize internal engagement for growth and development. Increasing the hiring effectiveness of an organization starts with its core workforce to truly impact overall business profitability. Managers are empowered to not only reduce time-to-fill, but more importantly, improve time-to-productivity for impacting business performance.

Details on project specifications are as follows:

  • Primary Dashboard created to measure New hires count in the form of charts, bad hires, summary of data.
  • New Hires report
    The New Hire Count, New Hires SPLY and Actives YoY % Change by Month combo chart shows that the company hired more people every month on the particular year compared to last year.
    In the combo chart New Hire Count and Active Employee Count by Region and Ethnicity
    The New Hires YoY Var by Age Group waterfall chart shows company is hiring mainly younger people.
    The New Hire Count by Gender pie chart shows a pretty even split
  • Active Employees vs. Separations Report
    Combo charts on the left show year-over-year change for active employees and separates.
    Looking at the pie charts, the even split can be noticed in the active employees by gender and age groups.
  • Bad Hires Report

Benefit Impact on Business :

The significant feedback came from the CEO of the organization saying “implementing the solution has cost less than 20% of the alternative solutions. The payback period was just a few months.. The impact of the system has been far reaching. Its simplicity of use and the valuable contribution it has made to business processes, have made it a strategic asset to our operations.”

The organization previously used to face difficulties to pull data in the desired format and lack of filters. It only now takes minutes to pull reports that would take an hour or more before. It also helped to bring data together from multiple sources that don’t typically talk to each other.

Major Focus Points :

KPI for Human Resources to analyses issues by individual, team, department, region, division, manager, role and many other factors
HR managers can visualize, interact, analyze, and respond to optimize recruitment metrics that matter most
This system empowers HR department to streamline their recruitment pipeline and align with the company’s strategy and growth.
Enabled an ability to monitor content with a 360° view of recruitment or run reports based on their selections and discoveries
Provides analysis at the speed of intuitive thought where users can instantly click through dimensions into drill-down groups for hierarchical recruitment data and cyclic groups for nonhierarchical data
Empowers recruiters to drill down to granular business detail on their own, increase speed and accuracy of relevant investigations
Creates a single, holistic view of recruitment information from multiple sources

Data Integration, Analysis & Business Intelligence System For Retail (Apparels)

Client : Pipey
Project : Data Integration, Analysis & Business Intelligence System For Retail (Apparels)
Industry : Retail (Apparels)
Application : Data Analysis , Business Intelligence & Reporting Management, ERP
About Project :

Pipey has several outlets located in various locations worldwide and every outlet stores their customer data in their respective database and it’s not mandatory that every outlet is using the same database. Some outlets use Oracle as a database, some use SAP, some stores just using flat files to store the sales data and so on.

A kind of system was anticipated which can seamlessly integrate all the massive amount of diversified data from all the various outlets, stored in various regional formats in one centralized place uniformly. Business Intelligence implementation to analyze all the data and scrutinize the sales, volume, which products are in major demand and which are not in demand, frequent customers, etc. Analytical reporting for executive decision makers to predict the revenue growth, transaction reporting etc.

At the same time, they also need various kind of dashboards to display different categories of data based on the executive level. For instance, CEO will be looking at high level summary report, Sales President would like to see sales figures data, Quality person would like to see product based data to identify which products are most selling and which are not.

In the nutshell, a complete Business Intelligence system with the data integration from various places, analyzing data and presenting in interactive dashboards and reports to make the decision process faster and accurate.

Major Functional areas :

  • Providing ETL functionality
  • Moving and transforming data from various data stores to central repository
  • Managing and unifying the various formants of data, like data format, time format based on the country
  • Ensuring data integrity and data cleansing in a remarkable format
  • Integrating Heterogeneous data sources
  • Providing advanced analytical features such as complete data mining and key performance indicatory frameworks
  • Providing a complete reporting platform for people at different level in the organization
  • Dashboard management with filtering of data based on analyzed data

Solution Description :

Data residing in different sources are extracted which are in various forms (flat file, excel sheets, SAO, Oracle etc.) using ETL technique. The data then transformed into uniform format and at the end all data merged into single integrated data to be stored in data warehouse which is a centralized repository of organization.

Data stored in centralized repository is divided into Data Marts on which the analytical processing is followed. OLAP (Online analytical Processing) based analytical services are developed with data mining capabilities which as a result provides multi-dimensional structures called cubes to pre-calculate and store complex aggregations, and also to build mining models to perform data analysis which helps in identifying valuable information like what are the recent trends, patterns, dislikes of customers. This processed data can then be used by analysts to look data from different perspectives.

The collected analyzed data is then represented in the form of various kind of dashboards with multiple charts, graphs implying sales figures, volumes, sales by area, sales by brands and many more formats. These interactive dashboard combines data and graphical indicators to deliver at-a-glance summaries of information for users to view the state of the business and quickly respond.

Several reports were created to provide best analytical results, few of the majorly highlighted reports are :

  • Performance Reports includes Labor Cost Efficiency Graph, Customer Satisfaction Survey Results Graph, Processing Time Graph, OTC Sales Efficiency Graph, Budget Estimator Report
  • Performance Diagnostics includes Hourly Volume and Median Processing Time, Daily Volume and Median Processing Time, Weekly CRP Usage and OTC Sales Efficiency
  • Sales- Actual vs Projected by product class
  • Inventory value by product class

Performance metrics are presented graphically in web user interface, which makes the presentation easy to update, easy to reuse and produces excellent visualization. Application security facilities that authorized access to all tables, input forms and reports. The user interface is database schema-driven for most table maintenance dialogs. An application data dictionary and input form layout editor enable database schema updates to be deployed in minutes.

Details on project specifications are as follows:

  • Real-time data synchronization for operational & strategic decisions
  • Flexible platform connects to any source
  • Ability to analyze data across multiple attributes and time periods
  • Addition of calculations at runtime or within the relational OLAP model
  • Interactive user interface - Drill down, drill across, drill up, filter, pivot, and sort
  • Granular security access down to the cell and column level
  • Sophisticated caching of data and dimensions reduces query latency
  • Aggregate-aware architecture simplifies setup and improves user response times
  • Relational database storage architecture
  • Scheduling and report distribution
  • Ability to display dashboards, tables, crosstabs, charts and widgets
  • Sub-reports for highly complex layouts
  • Use of Report virtualizers to optimize memory consumption
  • Report output to PDF, HTML, CSV, XLS, TXT, RTF, and more
  • Internationalization and localization for global reporting management

Benefit Impact on Business :

At the end of its first quarter, results showed that the overall labor cost efficiency improved by 4.2%, the number of POs filled on time increased by 3%, OTC sales efficiency improved by 13.4% and central processing usage increased by 7.7% for the 300+ stores that started using this system.

Before the presence of this system there was no way to measure the performance consistently across the organization. Now, they can easily measure the performance of various stores and predict the consolidated result.

CEO of Pipey said “reports created by this system tells everything we need to know about the performance on a single page”.

Major Focus Points :

Extracting and Transforming large amount of data into central data warehouse
Analyzing the data of million records and making the data retrieval performance oriented
Dashboard management for people working in different hierarchical level in an organization
More than 150 Interactive Reports with several filters to provide various view of the data
99.9% accuracy in data analysis with high performance reports rendering within milliseconds to 5 seconds at maximum depending on the report size
Performance targets for peer groups are maintained with effective dates. Bonus amounts are tied to multi-level performance targets. This makes it easy set and raise the standards of excellence.

Sales & Marketing Intelligence System For Manufacturing

Client : VanArs
Project : Sales & Marketing Intelligence System For Manufacturing
Industry : Manufacturing
Application : Business Intelligence & Reporting Management, ERP
About Project :

VanArs’s CMO wanted to increase market share and discover growth opportunities. For some reasons, VanArs’s market share was declining, due to the improper vision of company’s statistical data and irregular strategies

To overcome these issues, a system was foreseen with the dashboards and the set of reports which can be observed by the Chief Marketing Officer (CMO) to keep an eye on the industry and his company’s market share, product volume, sales, and sentiment.

Solution Description :

The manufacturing process needs to be a well-oiled machine to prosper and the best way of achieving that is to have visibility on every procedure while seeing the big image. After analyzing VanArs current system problems and company’s data, Power BI was chosen as the Business Intelligence tool to create new system for VanArs.

Multiple dashboards with various executive tiles were created to present the company statistical data in summary form. Comparison charts which can help to understand how well the company planned for the year and investigate areas with huge deviations from the plan.

Manufacturers need to collaborate, monitor and communicate on available live data to achieve operational excellence. This system helps to monitor real time data from multiple sources into one dashboard and drill down to identify issues when necessary. Getting real time alerts with mobile apps and make the operations more efficient to achieve greater agility and minimize response times.

Monitoring the supply chain end-to-end and identify problems and bottlenecks before they reach critical processes. Sharing the dashboards with suppliers and partners so that they can adjust to the latest information available, making the processes leaner and smarter. Monitoring quality inputs and outputs from all sources, including the customers, to make quick and meaningful decisions that can improve manufacturing quality.

Details on project specifications are as follows:

  • CMO Dashboard was created with the market share, sales, and sentiment. It can be further drilled down to see the data broken down by region, time, and competition.
    The number tiles down the left column show industry sales volume this past year, market share, sales volume, sentiment score, sentiment gap, and total units sold.
    The top line chart shows how the market share fluctuates over time. The market share really drops in June. Also, R12M (Rolling 12 Months) share which was increasing for a while, is starting to stall.
    The biggest competitor is Aliqui (evident in the middle column chart tile.)
    Most of the business is in the East and Central regions.
    The line chart at the bottom shows that the dip in June is not seasonal – none of the competitors show the same trend.
    The two “Total Units” tiles show units sold, by segment and by region/manufacturer. The largest market segment for the industry are Productivity and Convenience.
  • Market Share Report
    The “Total Category Volume by Segment” bar chart in the middle on the right, is filtered to show top 2 segments. Filters on the right can be expanded to select the visualization. Under Visual Level Filters, that Segment is filtered to include only Convenience and Moderation. Filter can be modified by selecting Segment to expand that section and then checking Productivity to add that segment as well.
    Line chart shows the monthly market share and 12 month rolling market shares. Rolling 12 months data help in smoothing out monthly fluctuations and shows the long term trends. By selecting Convenience and then Moderation in the bar chart it display how much fluctuation in market share there is for each segment. The Moderation segment shows much more fluctuation in market share than the Convenience segment.
  • YTD Category Trend report
  • Sentiment Report
    Tweets, Facebook, blogs, articles, etc. contribute to sentiment which is shown in the two line charts. The sentiment chart in the top left shows that sentiment for our products were pretty much neutral up until February. Then a big drop started in February and bottomed out in June. What happened to cause this drop in sentiment? In February, several articles and blog posts rated VanArs’s customer service the worst in the industry. This bad press had a direct correlation to customer sentiment and sales. VanArs worked hard to improve customer service and customers and the industry took note. In July positive sentiment started to rise and then reached an all-time high in the 60s. This uptick in sentiment can be seen reflected in “Total Units by Month” on pages 1 and 3.
  • Competitive Product Analysis Report
    The bottom left chart shows all the category segments except for VanArs’s two strongest segments. Filtering by category by clicking on the bars helps identify potential expansion areas for VanArs. The Extreme and Productivity segments display how these segments are growing faster than others.

Benefit Impact on Business :

The real time visibility provided by this system made the company decision taking processes more efficient and faster. CMO was able to recognize on which months VanArs’s market share are declining and identify the significant dips. The TreeMaps in the reports were very helpful to know the competitors and their product volumes.

After six months, this business intelligence system increases the VanArs’s revenue by 18%.

Major Focus Points :

Drill down investigation directly from the dashboard
Sentiment gap to identify: which districts have the highest sentiment gap, how can management capitalize on this, and discover ways to replicate it in other districts.
Natural Language Queries were also implemented to support searching the data as per business need
Combination of various and relevant charts were implemented to provide better visualizations to the statistical data
Track key performance indicators in real time: machine utilization, process efficiency, costs, inventory levels, losses and cycle times.
Multiple data sources were used from diversified data sources from various locations in the form of Excel files, data stores, text files etc. All were connected in this system to get the unified business intelligence platform.